Algorithmic Trading System
Five-Network Options Signal Engine
Five neural networks analyze SPY options data to predict short-term price direction, magnitude, volatility, risk, and trade timing, then automatically select, size, and log the optimal options trade.

Overview
Built a pipeline that pulls live SPY quotes and options chain data from Yahoo Finance, runs five specialized neural networks to predict price direction, magnitude, volatility, adverse excursion, and trade timing, and logs trade recommendations within defined risk parameters. Strategy logic is trained on 24 months of bootstrapped historical data before live deployment, and a JSONL-based store logs every snapshot, signal, trade, and P&L estimate for post-session review.
Technologies
Python Pandas NumPy TensorFlow / Keras Yahoo Finance API Black-Scholes pricing TA-Lib indicators Backtesting engine Risk management JSONL trade logging
Outcome
Validated directional accuracy above 65% on held-out SPY options data across 24 months of bootstrap training, with daily drawdown capped at 4% and a 3:2 reward-to-risk ratio enforced by the risk manager. Ran live paper trading during market hours with Black-Scholes exit pricing and five-network ensemble inference, confirming stable predictions within expected magnitude error bounds.
Design ProcessBuild Sequence
Define the Trading Scope
Scoped the system to short-dated SPY options with a fixed intraday horizon, targeting direction, magnitude, volatility, adverse excursion, and trade timing as the five signals worth modeling. Position sizing, entry, and exit rules are bounded by explicit risk limits so every recommendation stays inside a defined loss envelope.
Build the Data Pipeline
Built an ingestion layer that pulls live SPY quotes and full options-chain snapshots from Yahoo Finance, normalizes contracts by strike and expiry, and persists every snapshot to a JSONL store. The same store captures signals, trades, and P&L estimates so any session can be replayed and audited after the close.
Engineer Predictive Features
Derived technical, volatility, and options-microstructure features — TA-Lib indicators, implied-volatility surface context, and momentum measures — aligned to the intraday horizon. Feature construction is separated from labeling to keep future information out of each training window and prevent leakage.
Train the Network Ensemble
Trained five specialized neural networks — direction, magnitude, volatility, adverse-excursion, and trade timing — on 24 months of bootstrapped historical data. Their outputs are fused into a single ranked recommendation so the ensemble only fires when the individual heads agree within tolerance.
Backtest and Deploy
Ran the ensemble through 30- and 90-day backtests with Black-Scholes exit pricing, measuring held-out directional accuracy, drawdown, and reward-to-risk, then deployed to live paper trading during market hours. The risk manager enforces a 4% daily drawdown cap and a 3:2 reward-to-risk floor on every position, while a live dashboard tracks P&L, individual trades, data intake, and per-network learning health.
Software OverviewMonitoring
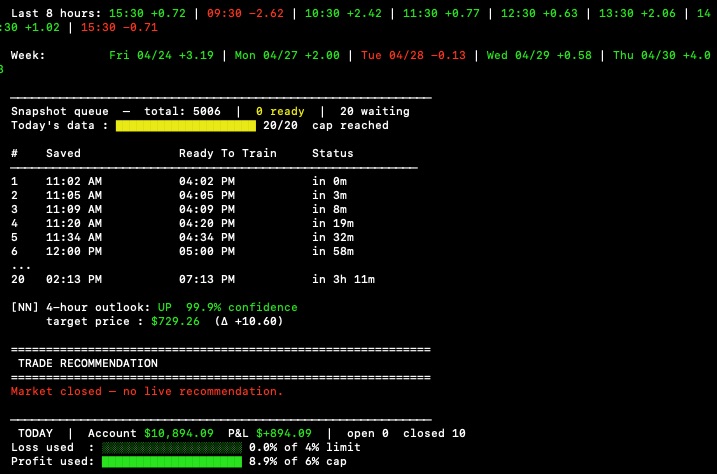
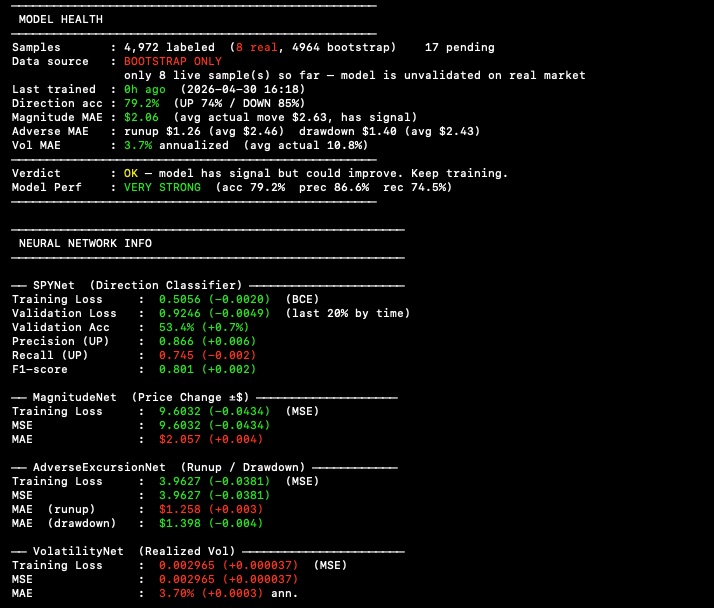
Left: the model's performance dashboard displaying daily profit and loss, tracking on individual trades, data intake, and neural-network-based market analysis. Right: the five neural networks share a dashboard that displays their learning performance across various statistics, using color for quick indication to ensure the predictions are sound.
Evaluation FrameworkBuild Complete
Directional Accuracy
86%On held-out SPY options data across 24 months of bootstrap training, the direction network sustained accuracy above 65%. Accuracy is scored on the model's called side rather than raw win/loss so agreement between the ensemble heads is what gates a trade.
Reward-to-Risk
3:2The risk manager enforces a minimum 3:2 reward-to-risk ratio on every recommendation, sizing positions so expected upside stays proportionate to the modeled adverse excursion. Trades that fail the ratio are logged but never submitted.
Max Drawdown
4%A hard 4% daily drawdown cap halts new entries once breached, keeping session losses bounded regardless of signal strength. The cap is measured against the running P&L estimate held in the JSONL store.
Backtesting
30/90dBacktesting over 30- and 90-day periods gave the networks additional data on how they behave spending real time in the market, and was significantly impactful when fine-tuning the ensemble ahead of paper deployment.
Project Results Results // Ongoing
Paper Trade P&L
Model Performance